To start out, you need to get the data, which is available from the open data pilot portal of the Swiss government, in the politics section. The data comes in CSV, which is going to be relatively easy to work with.
For the visualization, we're going to use the web tool Raw which lets you rapidly plot CSV data. You can paste in the data, choose a visualization type, and assign axes and categories to the columns. To get started, download the CSV, open it in a text editor, and paste the whole thing into Raw:
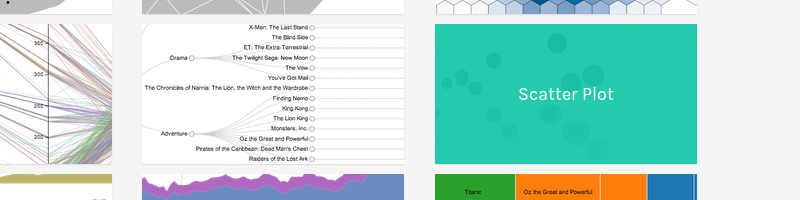
For this visualization, choose Scatter Plot, which is one of the simplest options Raw offers.
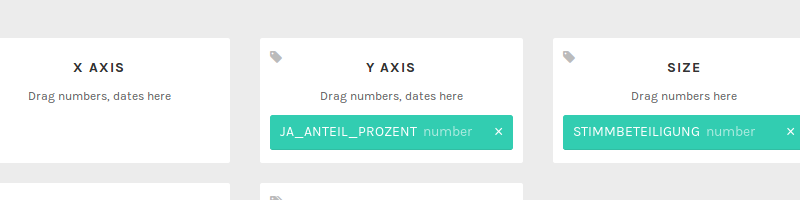
Now, you can assign columns to properties on the scatter plot: let's map JA_ANTEIL_PROZENT (% yes votes) to the y-axis, and STIMMBETEILIGUNG (voter participation) to the size of the dots.
At this point, it would make sense to map the date onto the x-axis, but unfortunately, Raw doesn't recognize the date column as a numerical value. This means you have to convert the column into something more useful: the year rather than the full date. In more fully-featured data visualization work, this kind of data conversion and cleaning often takes a lot of the total time.
There's a bunch of ways to fix this, including the extremely tedious option of changing the data by hand. The easiest way I found was to import the data into a spreadsheet program (Excel, OpenOffice, Google Docs) and create an extra column with a simple formula to extract the year part of the date. In the case of OpenOffice, you can use the RIGHT function that gives you the rightmost letters of a field.
Export the result as CSV again, and paste it into the half-finished Raw page. Now you can assign the year column to the x-axis. This is the result:
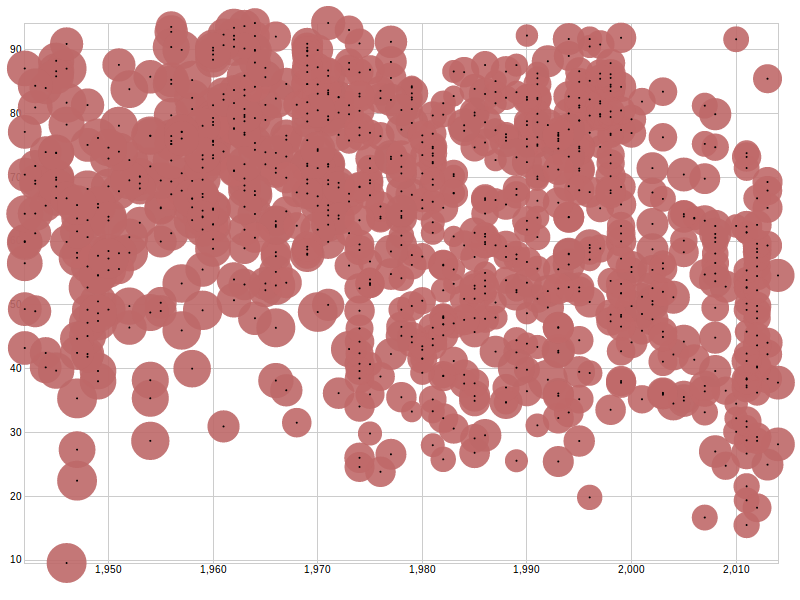
Eyeballing the graph, you can see that there's a noticeable bend in the trend: referenda tended to get the most positive votes in the mid-sixties, and since then, apart from a short rally in the late 90s, rejection has become more likely. In the decade between 1960 and 1970, nearly all referenda passed the 50% mark, while in the decade of the 2010 so far, there has been something like an even split.
This brings us to the second part of working with open data: interpretation. We can tell that there's a change over time, but what causes it? When I originally put this graph together at around half past midnight, people were quick to offer their explanations: the falling proportion of yes votes was because of right-wing parties trying to push awful legislation. Or it was because of a decline in the feeling of national community resulting in a divided voting public.
You could equally well argue that the cause was a surge of disruptive left-wing sentiment voting against sensible ideas, or a sign of a healthy and robust political discourse where new laws are properly discussed and not every idea necessarily gets majority support.
My point is that we don't know. Having some data is one thing, but the story you tell alongside it is another. Just because the data is correct doesn't mean that the story you're being told along with it is true. And that's where I see potential problems with open data. You can take some "official" data, present it in a particular way, and tell a particular story that suits you.
And that's before we even get onto the topic of what you can do to frame and distort the data. The most infamous case of this - though supposedly accidental - was Reuters' gun deaths graph, where they actually inverted the y-axis, which made it look as if controversial "stand your ground" laws reduced gun deaths...
Nor does this kind of thing have to be intentional. Real data is often a lot more complex than a nice time series, and riddled with caveats. As a fictional example, let's say you have some data on frog populations in various wetland preserves. Initially, different local agencies use different methods to count the frogs. Maybe some of them use traps, and others just go out and count them. At some point, the central agency makes everyone switch to the same frog-counting method to standardize things and allow for better comparisons. However, this change means that places that counted frogs differently before see a sudden massive change in frog numbers. Different methods give different results in a systemic way, and you can't directly compare between numbers gained by two different methods.
Now someone well-intentioned comes along and downloads the raw data on those frog numbers, and finds that there was a massive decline in frog counts from one year to the next. It looks like those poor frogs are in terrible danger! They write an impassioned plea to Save The Frogs, accompanied by graphs showing the precipitous decline. But actually, the frogs are doing just fine.
Raw data means non-normalized data, which is good in the sense that you can do your own research on the basis of it - but real raw data is riddled with caveats like "we changed the frog counting method halfway through". When advocating for the release of open data, there's often a struggle where the data creators want to publish reports and simplified cleaned-up data instead of the raw stuff. This can happen for good reasons, like privacy, or bad reasons, like wanting to shape public perception by being able to supply a particular slant along with the data. And it can happen for practical reasons, like the worry that the caveats and details like frog counting methods will be ignored.
In conclusion, open data is a powerful tool for improved discourse, new applications, and verification - but look out for caveats, and be aware that there's usually more than one story that can be fit to the data.